This guide provides detailed step-by-step instructions to create a dashboard or report page in the Sabasi Dashboard application.
1. Log In
- Access the Sabasi Dashboard using your login credentials.
- Once logged in, you’ll land on the Overview Page, which provides a summary of your platform’s activity.
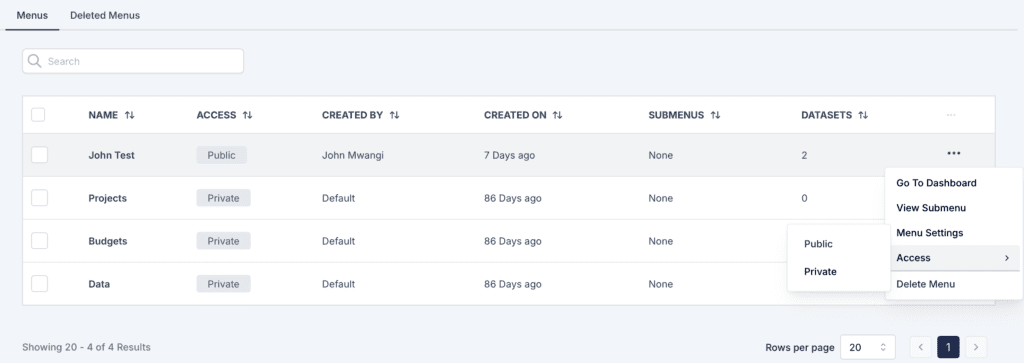
2. Define Menus
- Navigate to the “Menus” section from the left-hand navigation panel.
- Create or define a new menu structure:
- Click “Add Menu” (if available).
- Enter the menu name.
- Set the access type (e.g., Public or Private).
- Configure other relevant settings under Menu Settings.
- Menus are essential for organizing dashboards and reports for easy access and management.
3. Select the Target Menu
- Locate the menu where you want to create or manage a dashboard.
- Click the More Actions button (three dots) next to the menu name and select “Go to Dashboard”.
- You will be redirected to the dashboard page for that specific menu.
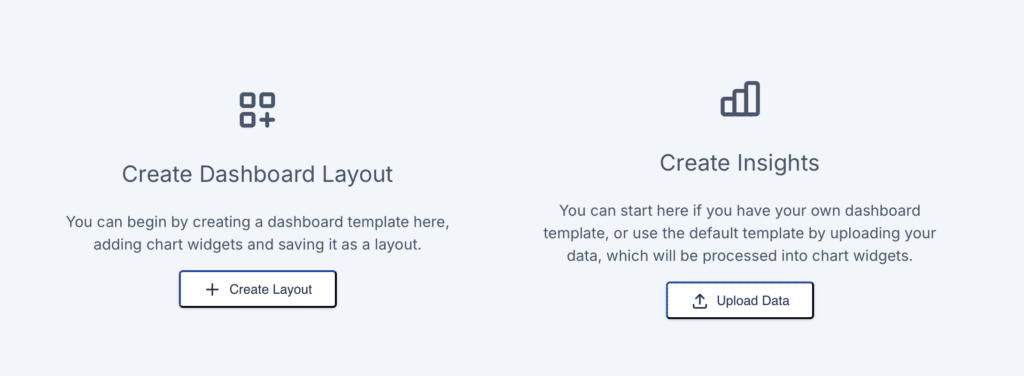
4. Choose Your Next Step on the Dashboard Page
- On the dashboard landing page, you have two options:
- Create Layout:
- Select this option to design a custom layout for your dashboard.
- Add widgets such as charts, graphs, or text blocks.
- Arrange and organize the layout as needed.
- Once satisfied, click Save to store your custom layout.
- After saving, proceed to upload data for visualization.
- Upload Data:
- Choose this option to use the system’s default layout for your dashboard.
- Upload the dataset you want to visualize and process into the dashboard.
- Ensure that the dataset meets the platform’s required format.
- Create Layout:
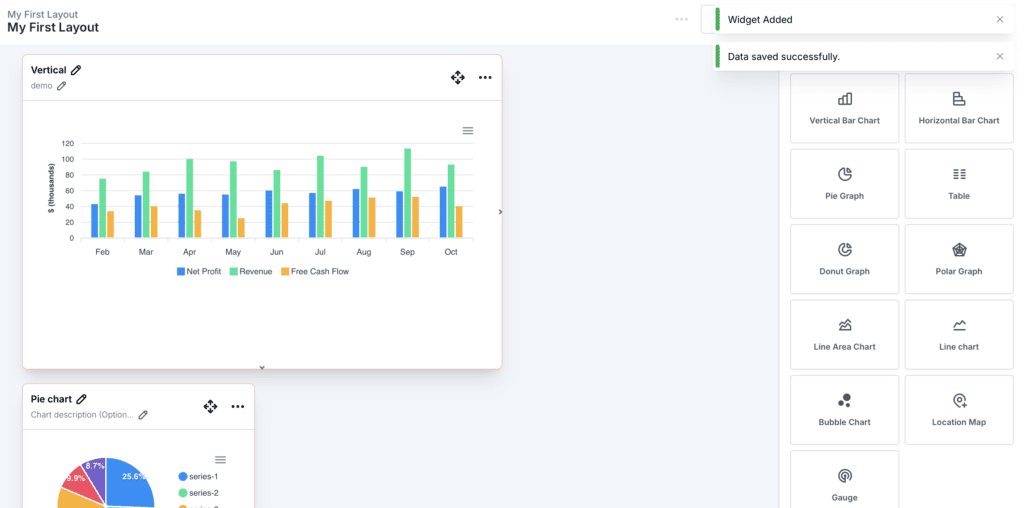
5. Customize the Dashboard
- After uploading data, customize your dashboard to fit your requirements:
- Add or edit widgets, such as graphs, charts, or metrics.
- Adjust the layout by repositioning widgets or modifying their sizes.
- Include additional elements like text blocks, banners, or images for context or branding.
6. Configure Filters
- Add filters to allow users to explore data interactively:
- Configure time-based filters (e.g., date ranges).
- Add category filters (e.g., department, user type).
- Test your filters to ensure they display accurate and relevant data.
7. Save and Publish
- Click Save to store your dashboard configuration.
- Click Publish to make the dashboard accessible to others:
- Public Dashboards: Viewable by all authorized users.
- Private Dashboards: Restricted to specific users or groups.
8. Share or Collaborate
- Use the Share or Invite Members feature to collaborate with team members.
- Assign appropriate permissions (e.g., View-only, Edit, or Admin) to collaborators.
Key Notes:
- Flexibility: You can revisit and modify your dashboard at any time to keep it updated.
- Organized Structure: Use menus and sub-menus to categorize dashboards for easier navigation and collaboration.
- Customization: Tailor your dashboard to fit your organization’s specific data visualization needs.
Summary
By following these steps, you can efficiently create, customize, and manage dashboards or report pages in the Sabasi Dashboard. Whether you’re creating custom layouts or uploading data directly, Sabasi provides all the tools you need to make data-driven decisions effectively.