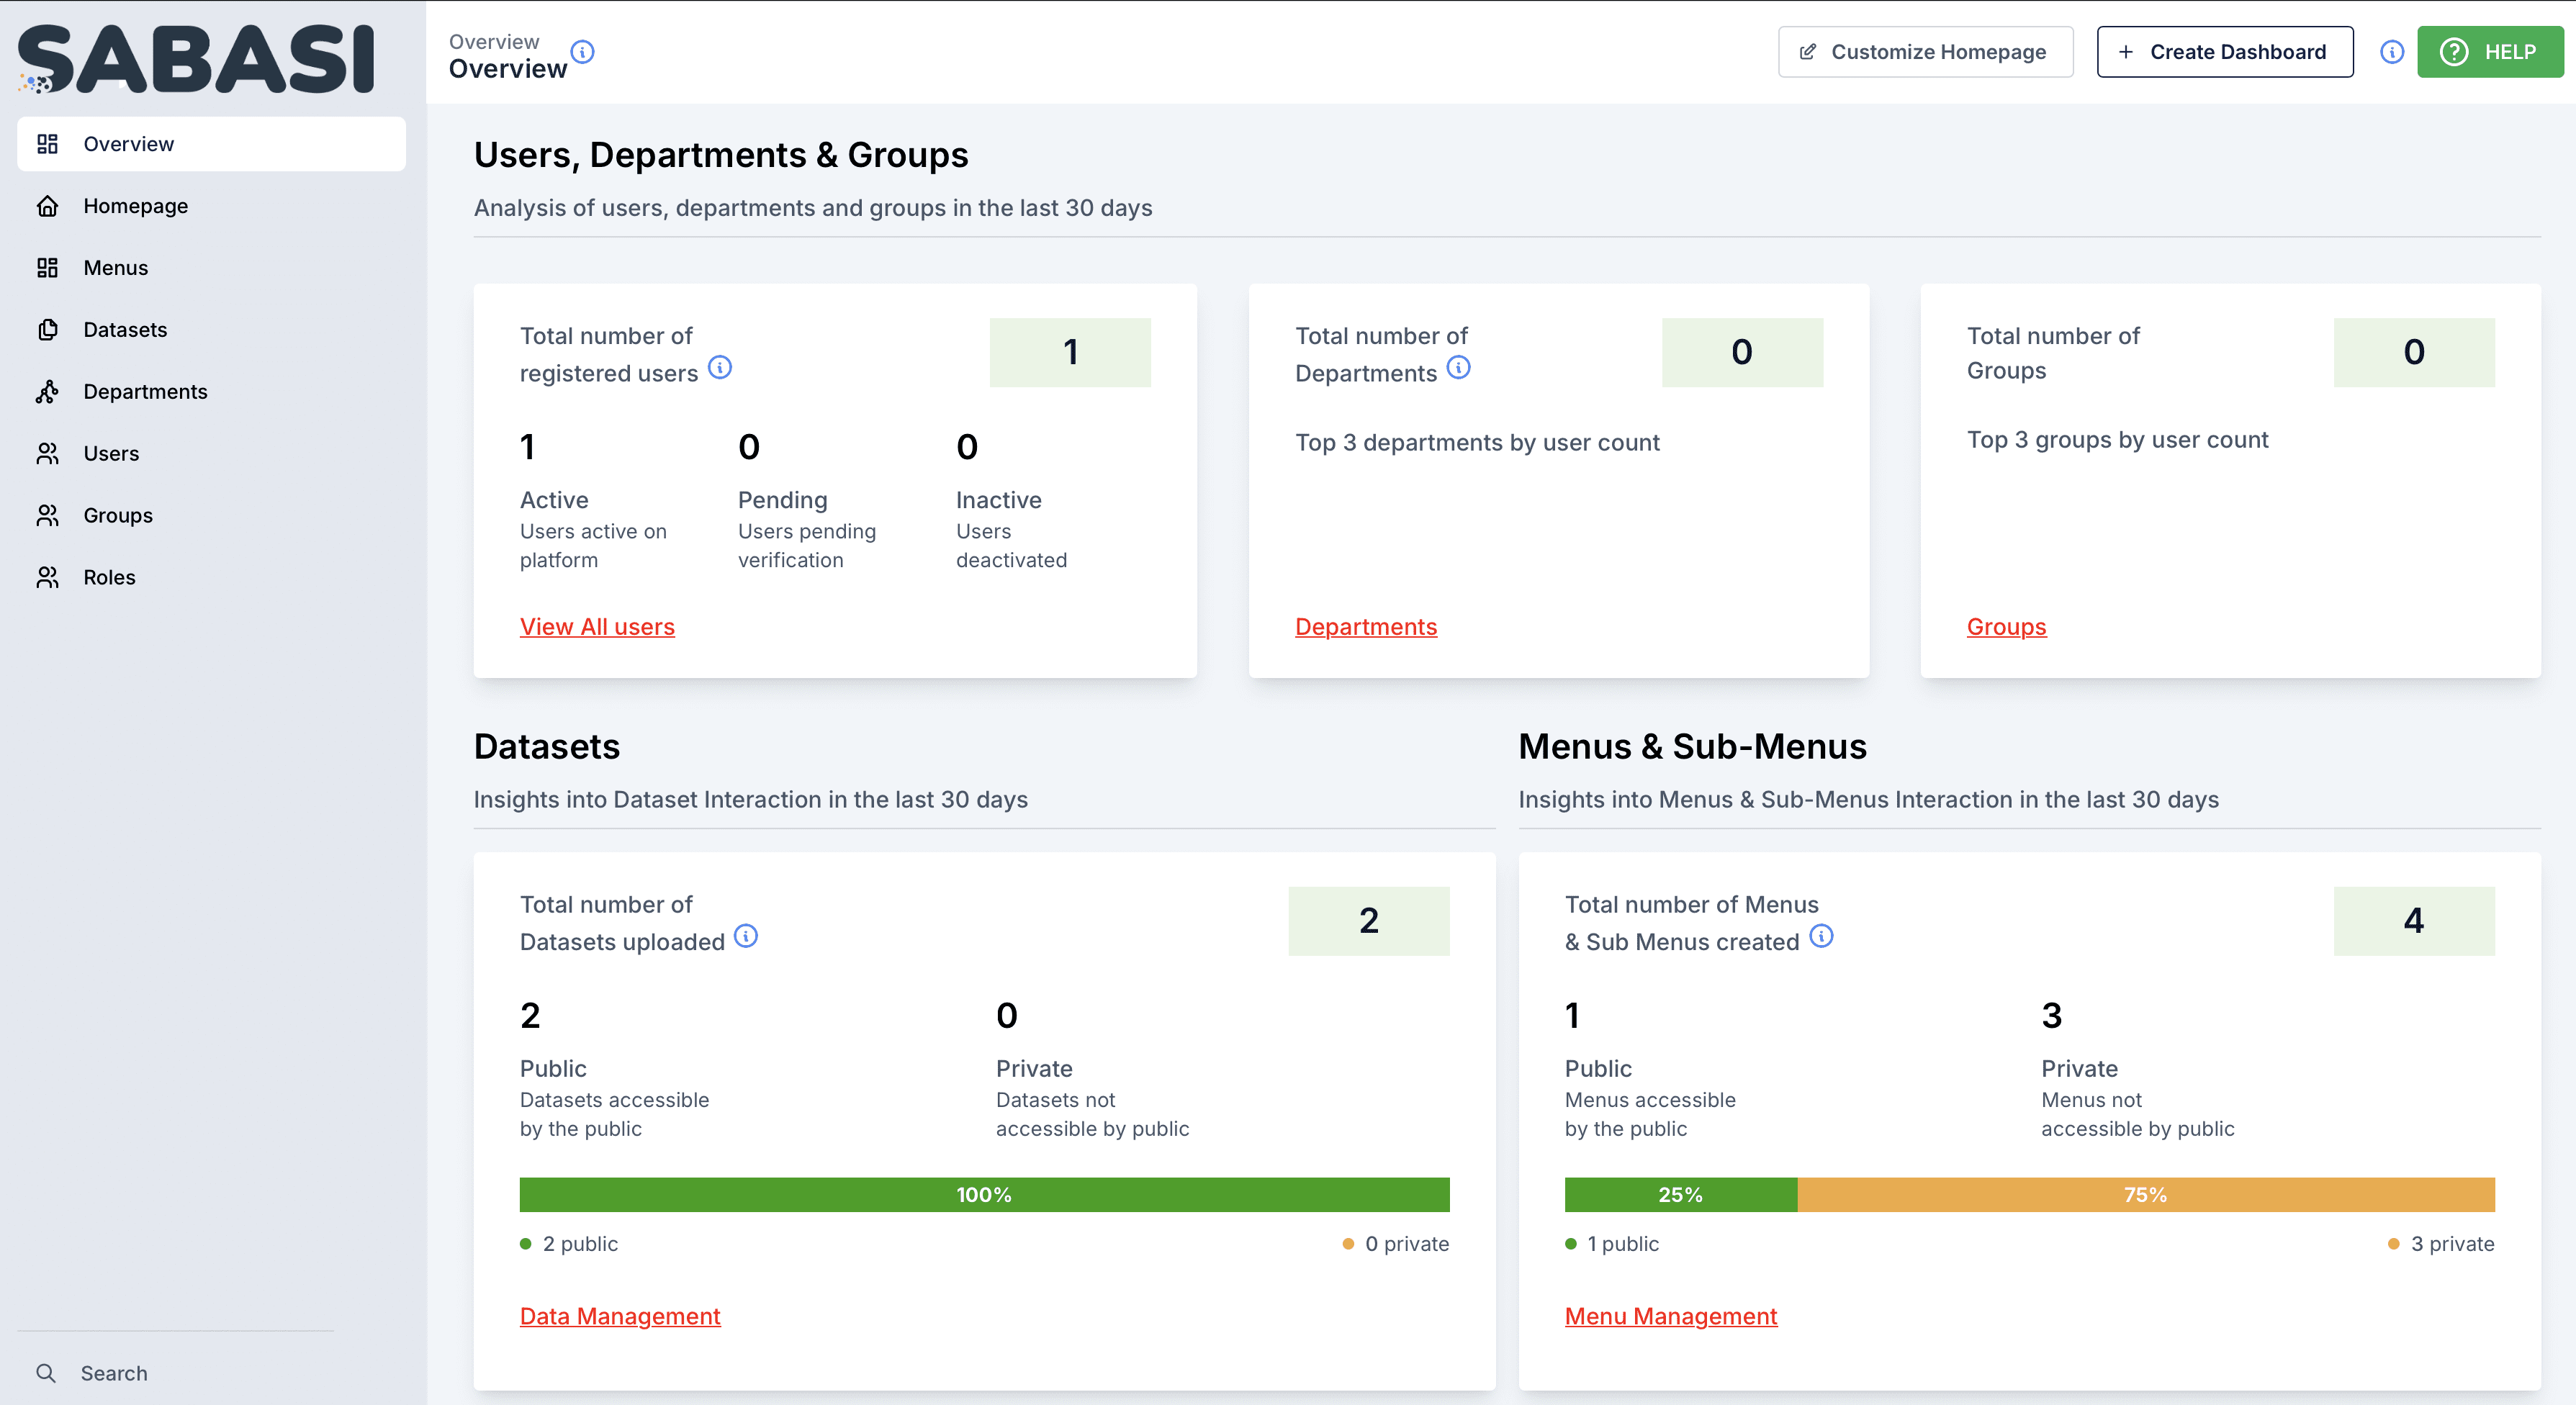
Overview
The Sabasi Dashboard provides a centralized platform for managing, visualizing, and interacting with organizational data. Designed for ease of use, the dashboard offers insights into users, departments, datasets, and menus, enabling administrators and users to make informed, data-driven decisions.
This guide provides an in-depth overview of the dashboard sections, troubleshooting tips, and answers to frequently asked questions.
Dashboard Sections
1. Users, Departments, and Groups
This section provides an analysis of users, departments, and groups within the last 30 days.
- Total Number of Registered Users:
- Active Users: Displays the count of users actively using the platform.
- Pending Verification: Lists users who have registered but are pending verification.
- Inactive Users: Shows the number of users who have been deactivated.
- How to Use:
- Click View All Users to access a detailed list of all users and their statuses.
- Administrators can filter by user type (active, pending, or inactive) to manage accounts.
- Total Number of Departments:
- Displays the number of registered departments and highlights the top 3 departments by user count.
- How to Use:
- Click Departments to view the list of all departments and their associated user data.
- Total Number of Groups:
- Displays the count of groups and highlights the top 3 groups by user count.
- How to Use:
- Click Groups to view and manage all groups on the platform.
2. Datasets
This section provides insights into datasets uploaded and their accessibility.
- Total Number of Datasets Uploaded:
- Displays the total number of datasets, categorized as:
- Public: Datasets accessible by all users.
- Private: Datasets restricted to specific users or groups.
- Includes a bar graph to show the percentage of public vs. private datasets.
- How to Use:
- Click Data Management to access a detailed list of datasets.
- Filter datasets by public or private to review and update their accessibility.
- Displays the total number of datasets, categorized as:
3. Menus and Sub-Menus
This section tracks the menus and sub-menus created in the last 30 days.
- Total Number of Menus and Sub-Menus Created:
- Categorized into:
- Public: Menus accessible to all users.
- Private: Menus restricted to certain users or roles.
- Includes a percentage breakdown of public vs. private menus.
- How to Use:
- Click Menu Management to view and manage menus.
- Update menu permissions or add new menus as needed.
- Categorized into:
Troubleshooting
1. Missing Data or Zero Values
- Issue: Some sections of the dashboard display zero values or missing data.
- Solution:
- Ensure the correct time frame is selected.
- Verify data uploads and entries are complete and up-to-date.
2. Inaccessible Sections
- Issue: Some sections or data are not accessible.
- Solution:
- Check your role and permissions. Certain features may require administrator access.
- Contact your organization admin to review your access rights.
3. Incorrect Dataset or User Counts
- Issue: The dashboard displays inaccurate data counts.
- Solution:
- Refresh the dashboard to ensure the latest data is displayed.
- Check the source of data uploads for errors or missing entries.