Overview
Drilldowns in the Sabasi Dashboard enable users to explore hierarchical relationships within datasets. This feature allows administrators to connect datasets and visualize deeper levels of data by interacting with visualizations. For example, clicking on a sub-county in a bar chart can reveal details about wards or schools within that sub-county.
1. Setting Up Drilldown
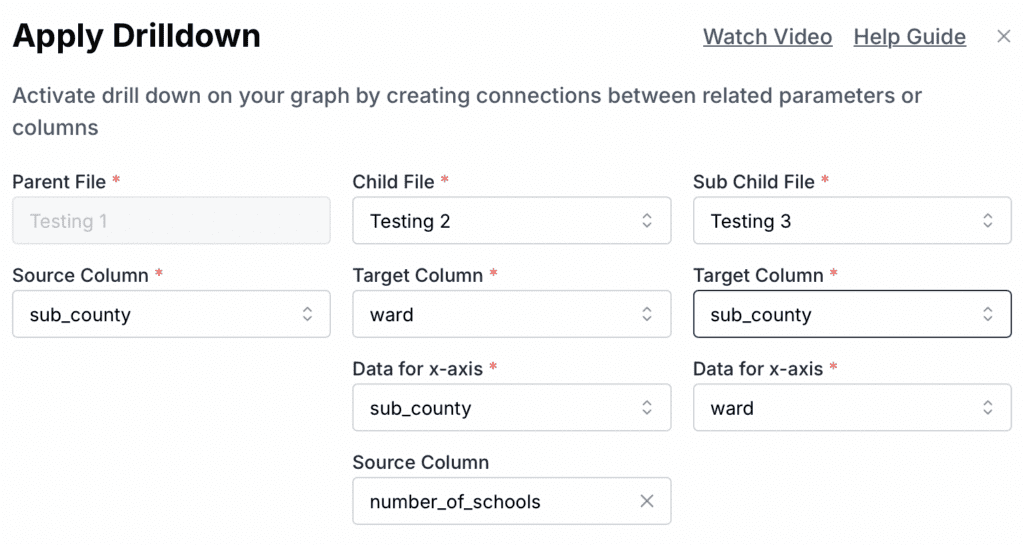
The Apply Drilldown tool connects a Parent File, a Child File, and optionally a Sub-Child File. These connections are based on shared columns (keys) between datasets.
Steps to Apply Drilldown
- Open the Drilldown Modal:
- Navigate to the desired widget and click on the Drilldown Configuration option.
- Configure Drilldown Parameters:
- Parent File: Select the primary dataset (e.g., “Testing 1”).
- Child File: Select the secondary dataset for deeper exploration (e.g., “Testing 2”).
- Sub-Child File (Optional): Select an additional dataset for a third level of drilldown (e.g., “Testing 3”).
- Source Column: Choose the column in the parent dataset that will act as the linking key (e.g.,
sub_county). - Target Column: Choose the column in the child dataset to match with the source column (e.g.,
sub_countyin “Testing 2”). - Configure additional columns as needed:
- Data for X-Axis: Specify the field for the horizontal axis (e.g.,
ward). - Source Column for Analysis: Select the data to display (e.g.,
number_of_schools).
- Data for X-Axis: Specify the field for the horizontal axis (e.g.,
- Save the Drilldown Configuration:
- Review the connections and click Save.
Example Configuration
- Parent File: “Testing 1” (Sub-county-level data).
- Child File: “Testing 2” (Ward-level data).
- Sub-Child File: “Testing 3” (School-level data).
- Source Column:
sub_county. - Target Column:
ward(Child) andsub_county(Sub-Child). - Outcome:
- Click on a sub-county (e.g., Kilifi North) in the bar chart to display data for its wards.
- Drill further into a ward to display schools within that ward.

2. Using Drilldown in Visualizations
Once drilldown is configured, the feature becomes interactive within widgets.
Steps:
- Interact with the widget:
- Click on a data point in the visualization (e.g., a sub-county bar in the chart).
- Drilldown:
- The chart updates to display data for the child dataset (e.g., wards in that sub-county).
- Continue drilling:
- If a sub-child file is configured, click on a ward to view detailed data for schools.
Example in Practice
- Initial View:
- Bar chart showing
number_of_schoolsfor each sub-county.
- Bar chart showing
- Drill into Sub-county:
- Click on “Kilifi North” to view wards in that sub-county.
- Example output: Chart shows
number_of_schoolsfor each ward in Kilifi North.
- Drill into Ward:
- Click on “Ward A” to view school-level data:
- Example output: Chart shows
number_of_schoolsandstudent_teacher_ratiofor schools in Ward A.
- Example output: Chart shows
- Click on “Ward A” to view school-level data:
Tips and Best Practices
- Ensure that the source and target columns have matching data types and values for accurate drilldown results.
- Use meaningful column names and dataset descriptions to avoid confusion when configuring drilldowns.
- Test the drilldown configuration thoroughly to ensure seamless navigation across levels.
What happens if columns do not match between datasets?
Drilldowns will not work unless the source column in the parent dataset matches the target column in the child dataset.
Can I apply filters to drilldowns?
Yes, filters can be applied to refine data before drilling down.
Can I customize the chart type for drilldowns?
Yes, each drilldown level can use different chart types depending on the dataset visualization.