Overview
In the Sabasi Dashboard, administrators and data managers can set a default dataset for a dashboard. This ensures that when users access a publicly shared dashboard, a specific dataset is displayed by default. Furthermore, each widget within the dashboard can be customized to pull data from different datasets, allowing for a mix-and-match approach to reporting.
Example:
Scenario:
You are an administrator managing a dashboard for Kilifi County Schools Performance. You have two datasets:
- Testing 1: Contains data about the number of schools per sub-county.
- Testing 2: Contains data about the student-teacher ratio per sub-county.
Steps to Configure:
- Default Dataset:
- You decide to set “Testing 1” as the default dataset for the dashboard.
- When users access the dashboard, the default dataset “Testing 1” will be displayed, showing the number of schools per sub-county as the main report.
- Widget-Level Customization:
- You create two widgets in the dashboard:
- Bar Chart Widget:
- Pulls data from “Testing 1” to display the number of schools per sub-county.
- Pie Chart Widget:
- Pulls data from “Testing 2” to show the student-teacher ratio per sub-county.
- Bar Chart Widget:
- You create two widgets in the dashboard:
Outcome:
- Users accessing the Kilifi County Schools Performance Dashboard will initially see the default dataset “Testing 1” (Number of schools per sub-county).
- However, within the dashboard:
- The Bar Chart Widget provides insights into the number of schools.
- The Pie Chart Widget visualizes the student-teacher ratio, utilizing a different dataset.
This configuration allows administrators to combine data sources and customize dashboards, ensuring that users have a comprehensive view of insights from multiple datasets.
1. Setting the Default Dataset for a Dashboard
Steps:
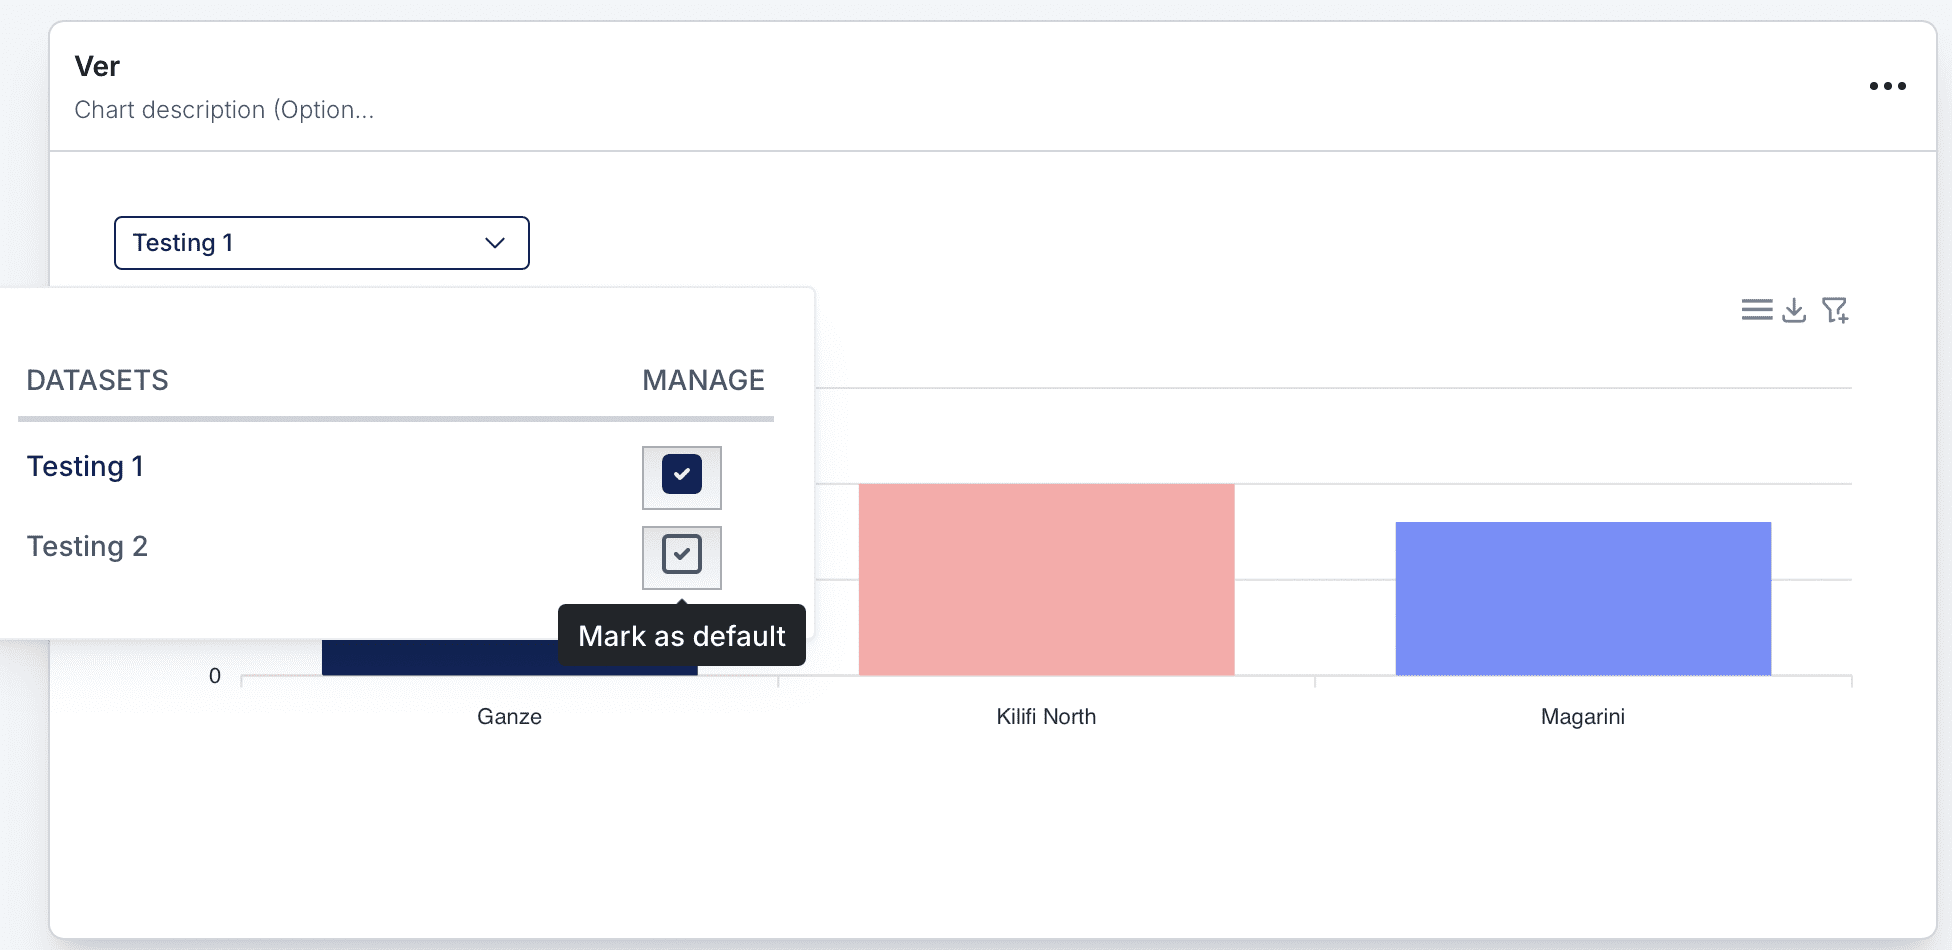
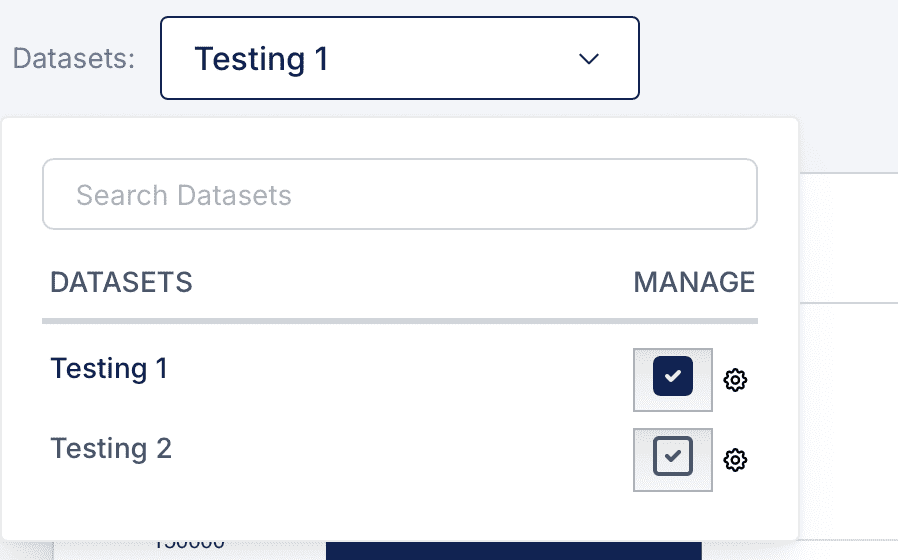
- Navigate to the Datasets dropdown menu in the selected dashboard.
- A list of datasets associated with the dashboard will appear.
- To set a dataset as the default:
- Click the checkbox next to the dataset name. The dataset marked with a checked box will become the default dataset for the dashboard.
- Once selected, the dashboard will always display the default dataset when accessed publicly or by users.

2. Setting Default Datasets for Individual Widgets
Steps:
- Locate the widget (e.g., bar chart, pie chart) on the dashboard.
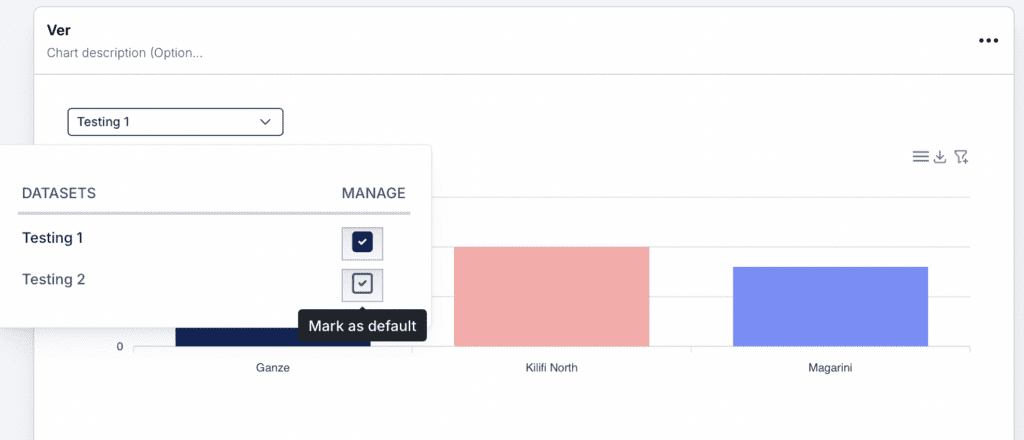
- Open the Datasets dropdown menu for the widget.
- The dropdown will show all datasets available for the dashboard.
- Select the dataset you want to associate with the widget by marking the checkbox.
- This allows each widget to pull data from a specific dataset:
- Example:
- Bar Chart: Uses data from “Dataset 1”.
- Pie Chart: Uses data from “Dataset 2”.
- Example:

3. Customizing Dashboards with Multiple Datasets
Features:
- Flexibility in Reporting: Mix and match datasets across widgets for detailed reporting.
- Widget Customization: Each widget in the dashboard can display data from a different dataset.
- Default View for Users: Public or shared dashboards always open with the default dataset unless customized by the viewer.
Tips and Best Practices
- Set default datasets that provide the most relevant or comprehensive data for the dashboard.
- Use descriptive names for widgets and datasets to help users navigate and understand the data.
- Take advantage of the widget-level dataset customization to create dynamic, multi-source dashboards.
Can multiple widgets use the same dataset?
Yes, multiple widgets can pull data from the same dataset.
Can a user viewing a dashboard switch datasets?
Yes, users can switch between datasets from the dropdown menu, but the default dataset is always loaded first.