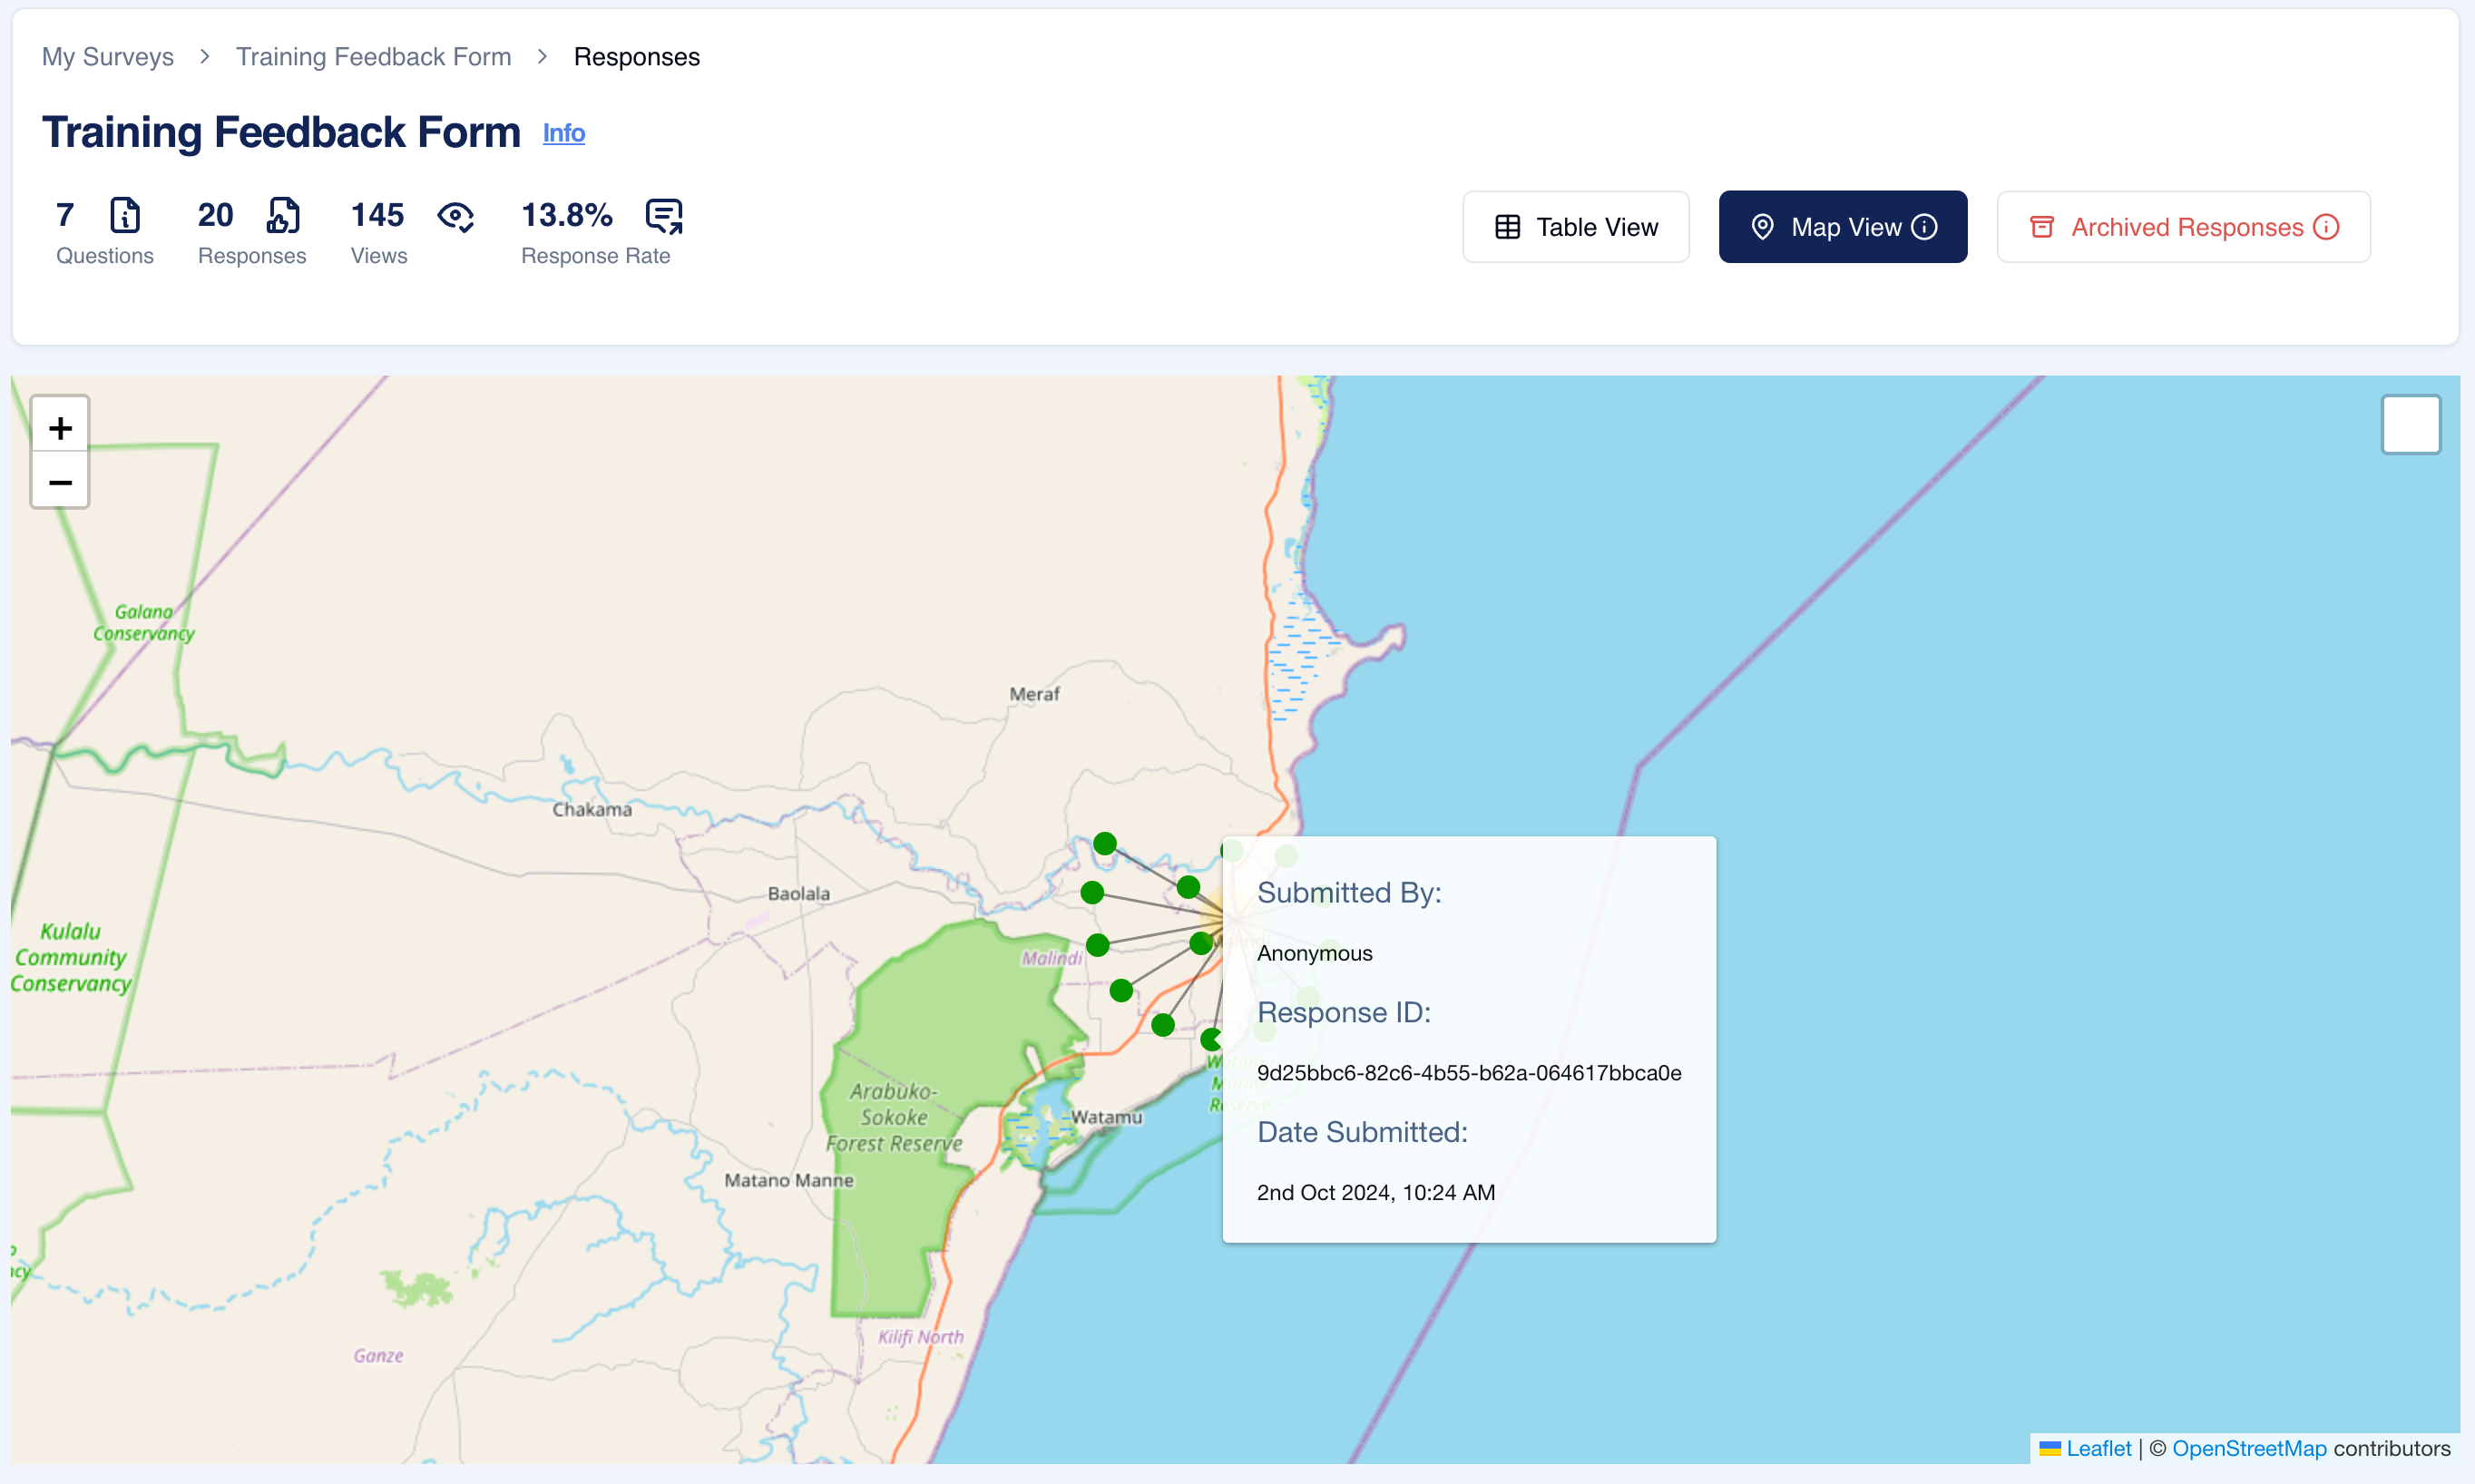
Overview:
The Map View Section in the Responses part of your survey settings allows you to visualize survey responses that are associated with geographical locations. This is particularly useful for surveys collecting data in different locations or for spatial analysis. The Map View provides a clear, interactive representation of where responses were submitted, enabling you to analyze geographic patterns and trends in the data.
Key Features:
- Location Data Visualization:
- View responses plotted on a map based on location data submitted with the survey responses. Locations are often collected through GPS or manual input fields.
- Interactive Map:
- Zoom in and out, pan across different regions, and interact with the map to see individual responses in specific locations. Hover over a point to view the corresponding response details.
- Clustered View:
- For surveys with many responses, nearby responses are clustered into groups for better visualization. You can click on a cluster to zoom in and view individual responses.
- Filter Responses by Region:
- Filter responses by geographic region to focus on specific areas. This is useful for analyzing data from particular locations or regions.
- Custom Map Layers:
- You can add custom layers, such as administrative boundaries, demographic overlays, or specific geographies, to the map. This helps to contextualize the response data within real-world or project-specific boundaries.
- Real-Time Updates:
- As new responses are submitted, the map updates in real-time, giving you up-to-date information about the geographic distribution of responses.
- Export Map Data:
- Export location-based data in formats like CSV or GeoJSON for further analysis in geographic information systems (GIS) or other mapping tools.
Tip
- Use Map View for Surveys in Remote Areas:
- For fieldwork or surveys conducted in multiple locations, the Map View provides valuable insights into how responses vary by location. This is especially useful in remote or rural areas where regional differences matter.
- Analyze Geographic Trends:
- If your survey data has a geographical component (such as health surveys, environmental studies, or customer feedback from various locations), use the Map View to detect trends based on region or area.
- Combine with Other Map Layers:
- Enhance the usefulness of the map by adding relevant map layers like population density or service areas. This can provide a richer context for your geographic data.
- Use Clustering for Dense Areas:
- If many responses are from densely populated areas, use the clustering feature to avoid overlapping markers and get a clearer view of response distribution.
- Filter by Region for Focused Insights:
- Focus on specific regions or administrative boundaries by using filters to understand how responses vary geographically. This is particularly helpful for decision-making in localized contexts.
Summary:
The Map View Section in Responses offers an interactive, geographical representation of your survey responses. It is especially useful for surveys collecting data across different locations, allowing you to visualize and analyze geographical patterns. Key features include real-time response updates on the map, clustering for dense areas, the ability to filter by geographic region, and exporting data for further analysis. The Map View provides an invaluable tool for surveys that require spatial data analysis, especially in fields such as environmental research, health surveys, and customer feedback from various locations.
Responses – Map View Section FAQ
Can I view multiple layers or geographic overlays on the map?
Yes, you can add custom layers such as administrative boundaries, project-specific geographies, or demographic data to provide additional context for the response data.
How are responses from the same location handled?
Responses from the same or nearby locations are clustered together to make the map easier to read. You can click on a cluster to zoom in and view individual responses.