Overview
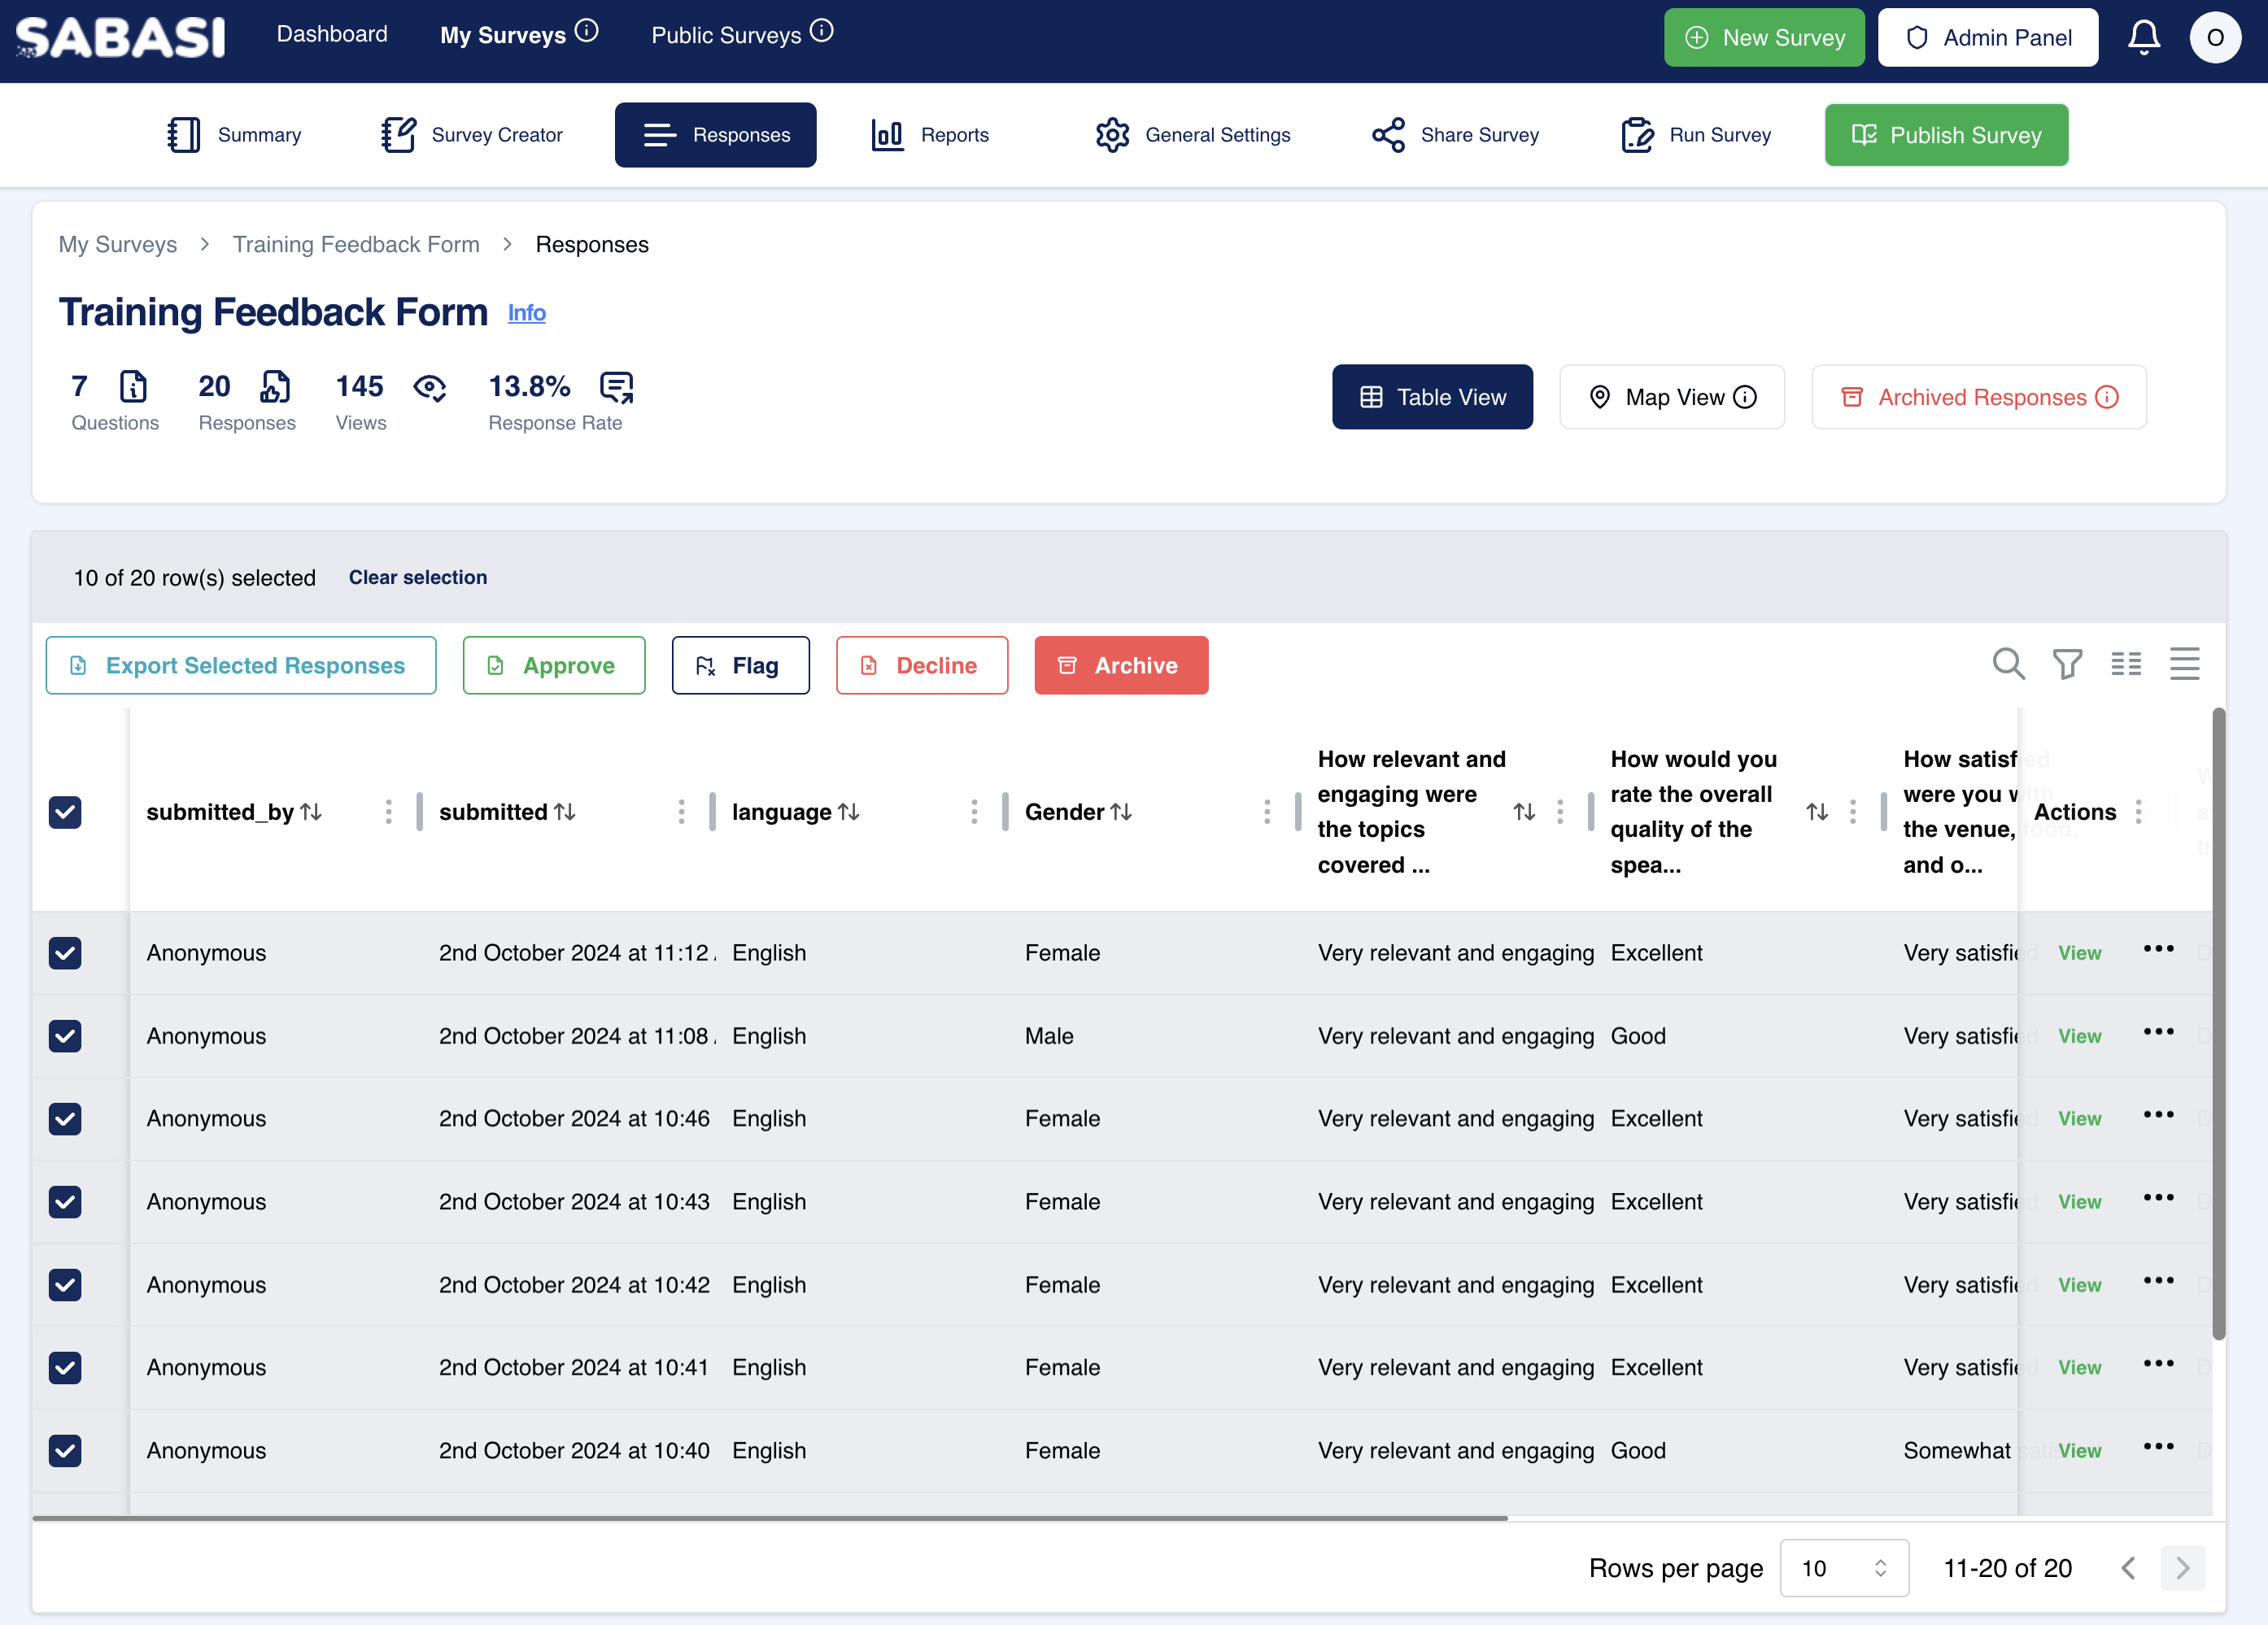
The Table View of Responses provides a detailed and structured representation of all survey responses. It displays each respondent’s data in rows, where each question from the survey corresponds to a column. This format makes it easy to review, compare, and analyze individual responses at a glance. The table view is the default setting for managing responses and offers a clear, organized display, perfect for tracking trends, evaluating feedback, and exporting data for further analysis.
Key Features
- Sortable Columns: Each column, such as submission date, respondent ID, and answers to specific questions, can be sorted either in ascending or descending order. This allows you to quickly organize responses by submission time, specific answers, or other parameters.
- Bulk Actions: At the top of the table, users can select one or multiple responses to perform actions such as exporting, flagging, approving, declining, or archiving responses. This feature is essential for efficiently managing large datasets.
- Export All Responses: The “Export All Responses” button allows users to export the entire dataset in various formats, such as CSV or Excel, for offline analysis or sharing with stakeholders.
- Filter Options: Built-in filters allow you to narrow down responses based on specific criteria, making it easier to focus on particular data points or analyze segmented data.
- Pagination Controls: The table can display a set number of rows per page, and users can easily switch between pages using the pagination controls at the bottom. This helps in navigating through responses efficiently, especially when dealing with large datasets.
- View Individual Response: Each row contains a “View” button that allows users to see the full details of a single response. This provides a more focused view for in-depth analysis of individual entries.
Tips for Using Table View of Responses
- Sort by Submission Date: If you want to see the most recent responses first, click on the “Submitted” column header to sort responses by date.
- Use Bulk Actions for Efficiency: If you’re reviewing multiple responses for a common action (such as approving or archiving), use the bulk action checkboxes and apply actions to multiple responses at once.
- Filter for Targeted Analysis: Utilize the filters to drill down into specific data points. For example, filter by responses with certain answers or by submission time frames.
- Export for Further Analysis: If you need more advanced analysis or reporting, exporting the data to Excel or CSV formats allows you to perform deeper statistical analysis using external tools.
Summary
The Table View of Responses is a powerful feature that provides a comprehensive and organized way to review and manage survey responses. Its sortable columns, bulk actions, filtering capabilities, and export options make it an essential tool for survey administrators who need to analyze data efficiently. By using the tips and features mentioned, users can streamline their response management workflow, ensuring that they get the most out of the data collected from.
Responses – Table View Section FAQ
How many responses can I view at once?
The default view shows a set number of rows per page (usually 10), but you can increase this to view more responses per page using the pagination controls at the bottom of the table.
Can I edit responses directly from the table view?
No, the table view only allows you to review responses. To make changes, you may need to export the data or manually update it in other parts of the system.
What file formats can I export responses in?
Responses can typically be exported in CSV or Excel formats, which can then be used for further analysis or reporting in other tools.
How can I filter responses based on specific answers?
You can apply filters by clicking on the filter icon next to each column, which allows you to set criteria for narrowing down responses based on specific answers or data points.